Small Landlord Statistics (2026): 48+ Data Points on Ownership, Costs, and How Mom-and-Pop Landlords Actually Operate
Individual investors still own 70% of U.S. rental properties — but their share is shrinking, costs are climbing, and 84.5% of rents now arrive on time. The 2026 numbers from Census, JCHS, IRS, and the Fed.
Educational, not personalized tax advice. Verified ; consult a CPA before filing.
General educational information — not personalized advice.
This article provides general educational information about U.S. federal tax topics for residential rental property owners. It is not personalized tax, legal, or accounting advice, and reading it does not create any professional-client relationship between you and Praneet Soni (publisher of RentLedger). Tax laws change frequently, individual circumstances vary, and a CPA, Enrolled Agent, or tax attorney licensed in your jurisdiction is the only appropriate party to advise on your specific filing decisions.
Figures and rules are current as of ; verify against IRS Publication 527 before relying on anything here. Content is provided "as is" without warranty of accuracy, completeness, or timeliness. Praneet Soni is not a licensed tax professional and is not liable for any decision made in reliance on this content.
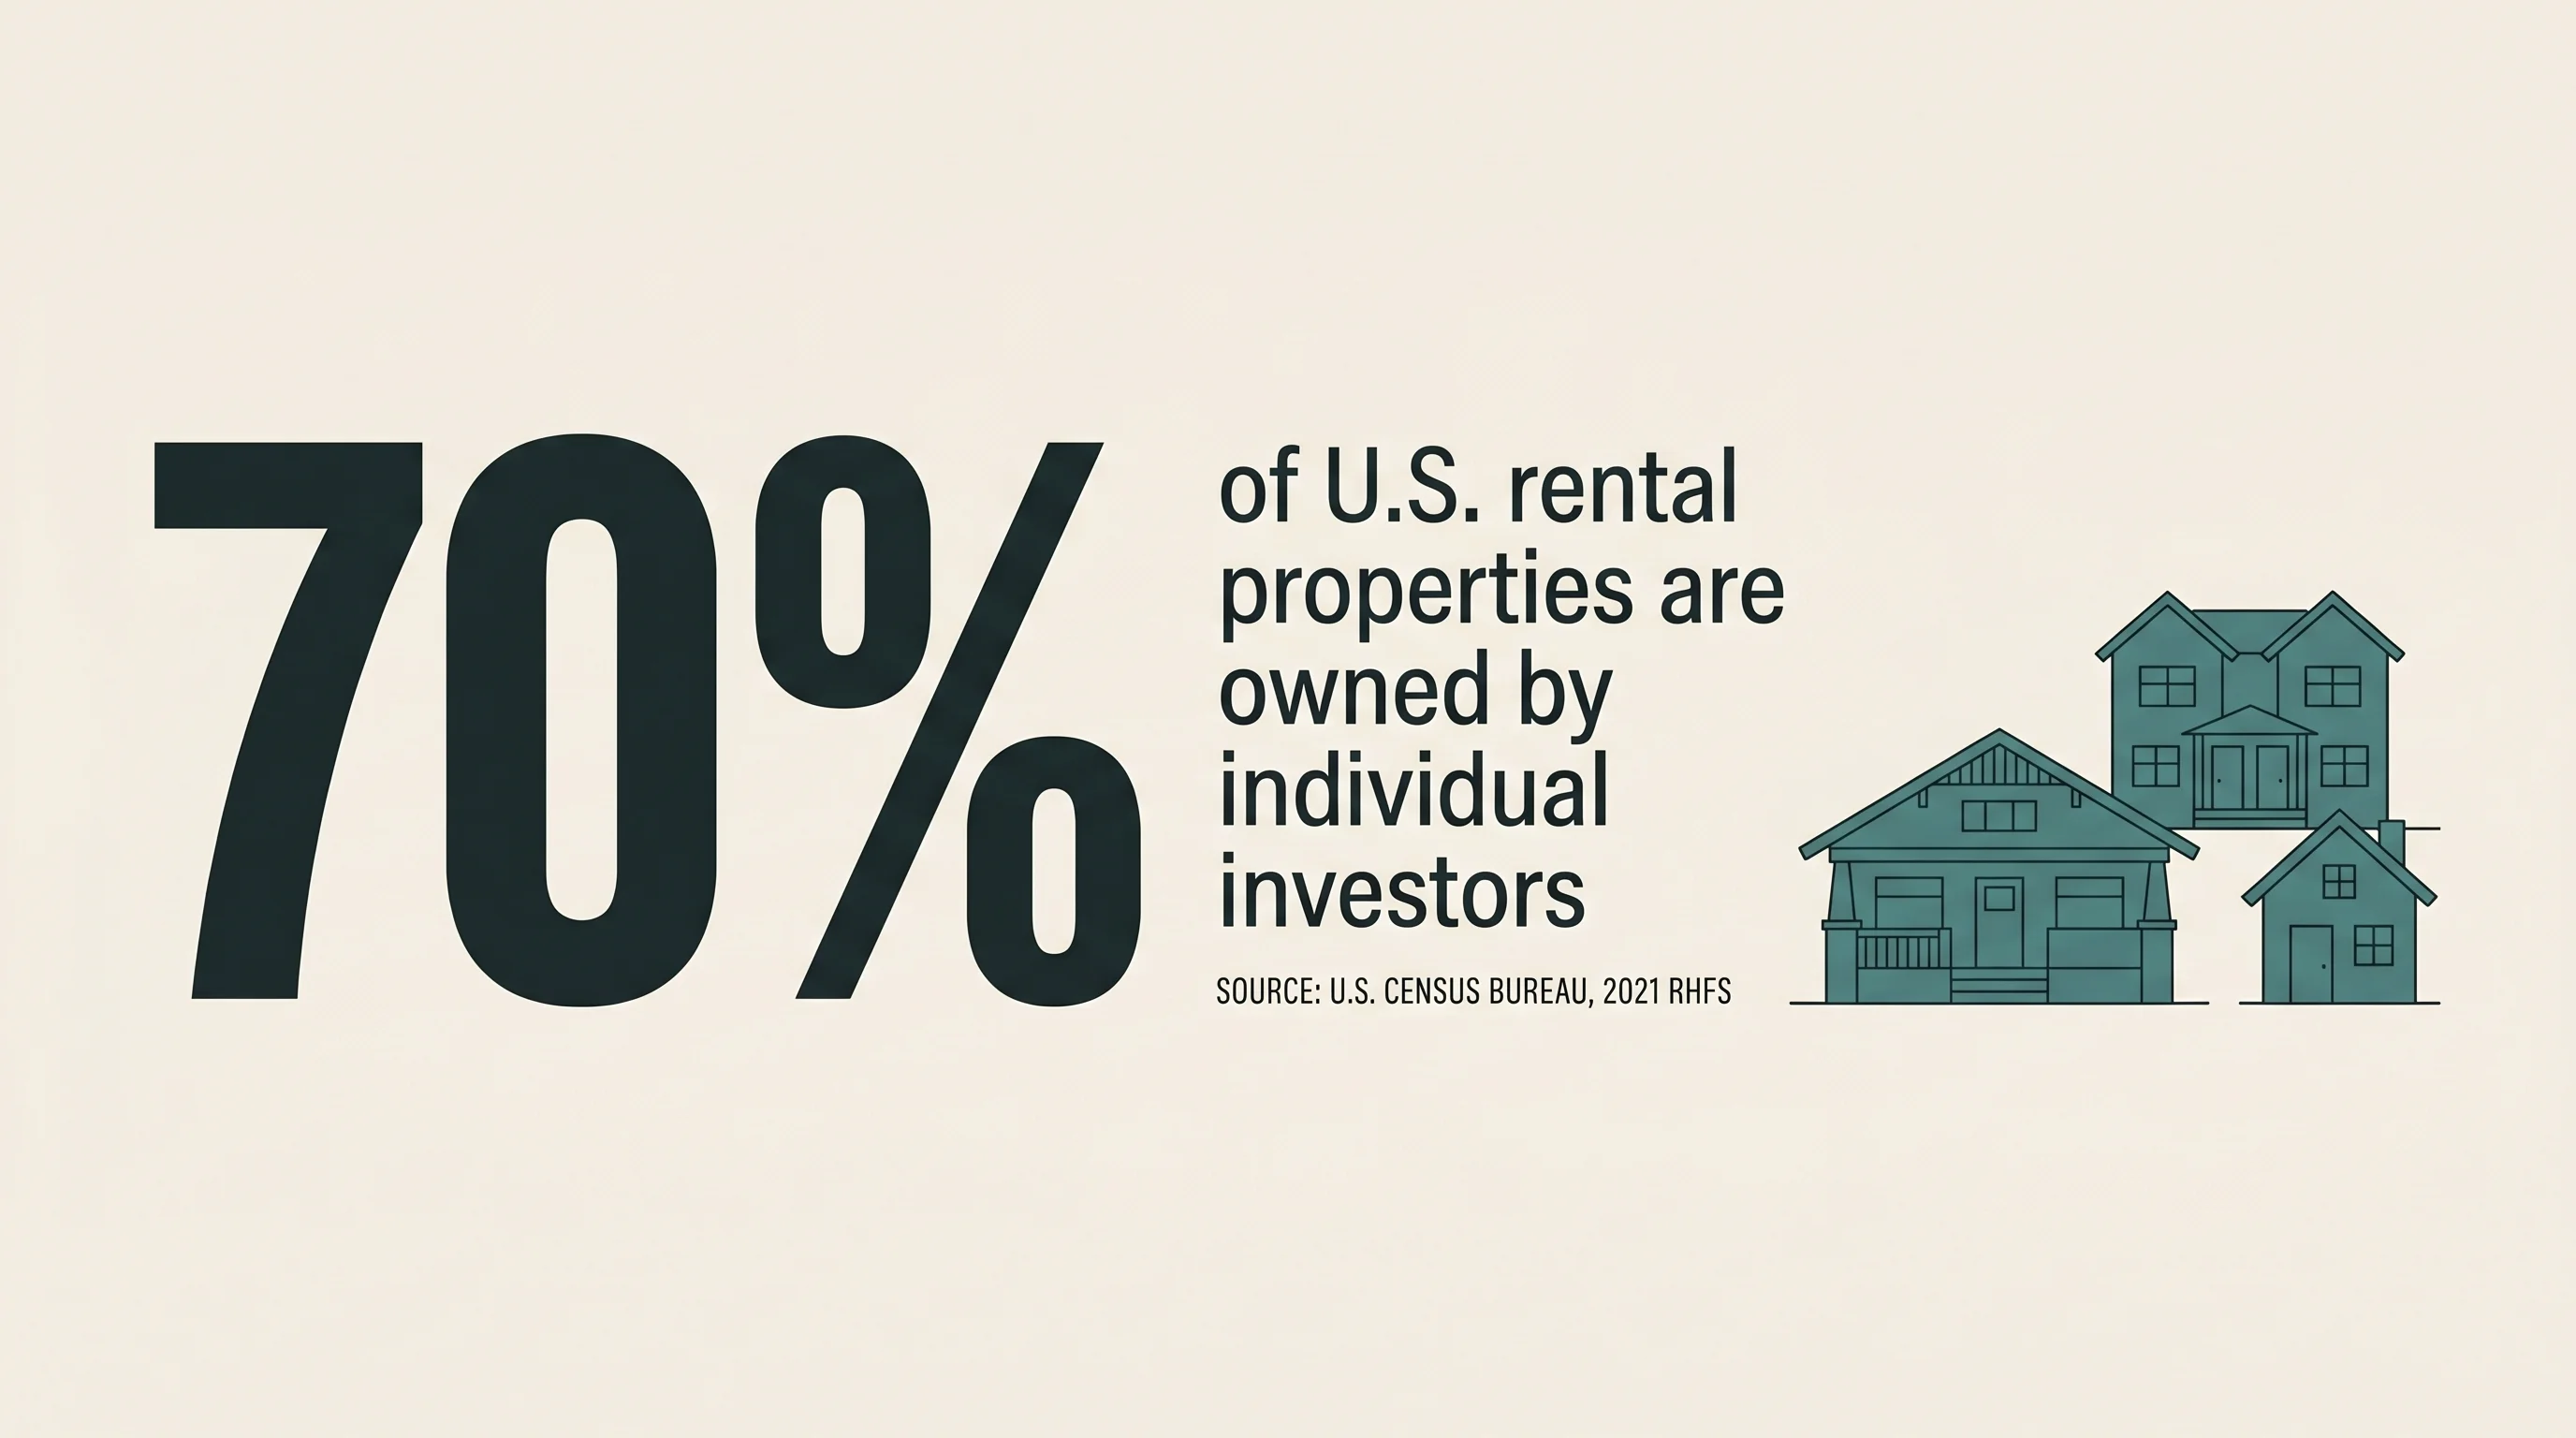
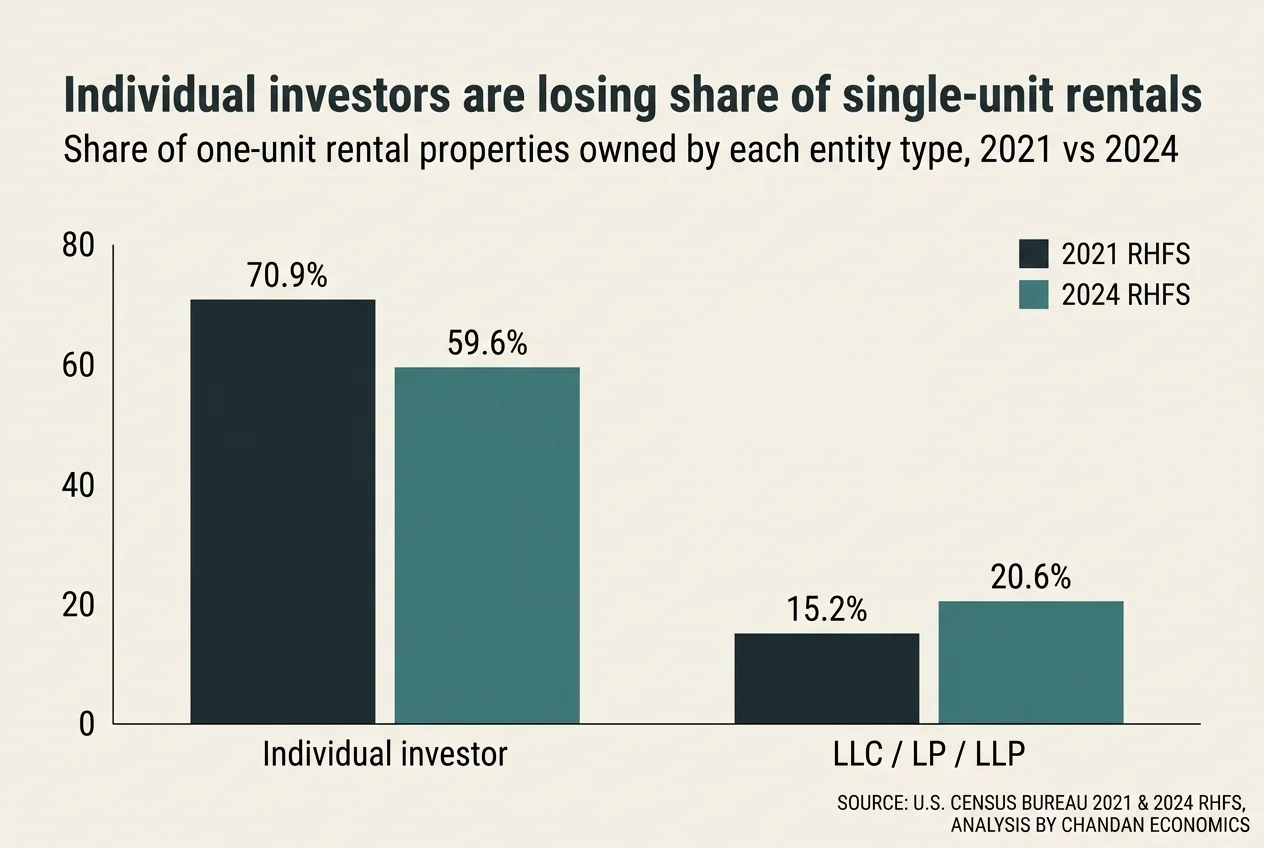
70% of U.S. rental properties are owned by individual investors (U.S. Census Bureau, 2021 Rental Housing Finance Survey, via Congressional Research Service R47332). The 2024 RHFS release shows that share is shrinking — individual ownership of single-unit rentals fell from 70.9% in 2021 to 59.6% in 2024 (Chandan Economics analysis of 2024 RHFS). 74.4% of these landlords say costs rose this year (Avail 2026 Independent Landlord Survey). 84.5% of rents arrived on time in April 2026, the 33rd consecutive month of year-over-year decline (Chandan Economics / RentRedi). We aggregated 48+ data points from the U.S. Census Bureau, IRS, HUD, the Joint Center for Housing Studies, the Federal Reserve, the CFPB, the Urban Institute, GAO, the Eviction Lab, and 4,000+-respondent industry surveys to map what running a small rental business in the United States actually looks like in 2026. Tools like RentLedger exist for this audience — landlords with one to ten units who track everything themselves — but the numbers below are everyone’s, sourced from public-domain reports and disclosed-methodology surveys only.
Key Takeaways
- 19.3 million rental properties, 49.5 million rental units in the U.S. (Census Bureau, 2021 RHFS).
- Individual investors own ~70% of rental properties (~38% of units); the share of single-unit rentals owned by individuals fell from 70.9% to 59.6% between the 2021 and 2024 RHFS (Chandan Economics, 2024 RHFS analysis).
- 86% of all rental properties contain only one rental unit; 46% of rental units are in 1–4-unit properties (Census Bureau, 2021 RHFS).
- Large institutional investors own ~3% of single-family rentals nationwide — concentrated in Atlanta (25%), Jacksonville (21%), and Charlotte (18%) (Urban Institute, 2023).
- 72.6% of independent landlords own between one and four units (Avail 2026 Independent Landlord Survey, n=4,055).
- 74.4% of landlords saw ownership costs rise this past year; 50% reported property tax hikes above 6% (Avail 2026; Baselane 2024 Real Estate Investor Survey, n≈2,116).
- Apartment property insurance climbed from $39 to $68 per unit per month, 2019–2024, in real terms — a 75%+ jump (Federal Reserve FEDS Notes, Sept 2025).
- April 2026 on-time payment rate: 84.5%, with a 97.2% forecast full-collection rate (Chandan Economics / RentRedi, Apr 2026).
- 78.3% of independent landlords pursue communication or payment plans before legal action; only 0.81% file an eviction as their first response to a missed payment (Avail 2026).
- Across the jurisdictions the Eviction Lab tracks, landlords filed 1,115,000 eviction cases in 2023 and just over 1 million in 2024 — and the top 100 filers in 15 tracked cities accounted for an average 32.6% of all filings, peaking at 58.2% in Greenville, SC (Eviction Lab). No federal database publishes a true national total.
- 22.4 million renter households are cost-burdened — an all-time high — paying more than 30% of income on rent and utilities (JCHS, America’s Rental Housing 2024).
- 32.9% of independent landlords plan to acquire more property in the next two years; only 6.6% intend to exit (Avail 2026).
1. Who owns U.S. rental housing — and who’s quietly taking over?
The headline does not change: small, individual landlords still own most of the rental properties in the country. The footnote does change: their share of single-unit rentals fell more than 11 points in three years as more owners moved properties into LLC and LP structures. Whether those LLCs are still mom-and-pop owners using legal wrappers or institutional capital using legal cover is the open question. What is not happening: Wall Street is not eating the single-family rental market — outside a handful of Sun Belt metros, large institutional investors own less than one in 25 single-family rentals.
| Metric | Value | Source |
|---|---|---|
| Total U.S. rental properties (2021) | 19.3 million | Census 2021 RHFS |
| Total U.S. rental units (2021) | 49.5 million | Census 2021 RHFS |
| Properties owned by individual investors | ~70% (representing 38% of units) | Census 2021 RHFS |
| 1–4 unit properties owned by individuals | 15.9 million (~70%) | Census 2021 RHFS |
| Properties containing only one rental unit | 86% | Census 2021 RHFS |
| Single-unit rentals owned by individuals (2021 → 2024) | 70.9% → 59.6% | Chandan Economics, 2024 RHFS |
| Single-unit rentals owned via LLC / LP / LLP (2021 → 2024) | 15.2% → 20.6% | Chandan Economics, 2024 RHFS |
| Single-unit rentals held in trust (2021 → 2024) | 1.9% → 6.8% | Chandan Economics, 2024 RHFS |
| Large institutional share of all single-family rentals | ~3% (<0.5% of all single-family stock) | Urban Institute, 2023 |
| Top-five institutional investors’ SFR holdings (2022) | ~300,000 homes (of ~450,000 across 32 firms) | GAO-24-106643, May 2024 |
Most recent comprehensive ownership-by-property-size data: 2021 RHFS. The 2024 RHFS public-use files were released February 2026; equivalent property-count tables are still being summarized.
2. What does the typical small landlord look like?
The composite small landlord owns one to four units, has been doing this for under five years, screens for credit before all else, and quietly plans to buy more. Avail’s 2026 survey of 4,055 independent landlords is the highest-resolution recent profile of this group. Two stats deserve attention: almost half of independent landlords have managed properties for three years or less, and a third plan to acquire more in the next two years. This is not a graying cohort hanging on for dividends — it’s an actively expanding group of part-time business operators.
| Metric | Value | Source |
|---|---|---|
| Independent landlords who own 1–4 units | 72.6% | Avail 2026 Survey |
| Have managed properties for 3 years or less | 47.4% | Avail 2026 Survey |
| Plan to acquire more property in next 2 years | 32.9% | Avail 2026 Survey |
| Plan to exit the market | 6.6% | Avail 2026 Survey |
| Real-estate investors planning portfolio growth (next 2 years) | 81% | Baselane 2024 Survey |
| Rank credit score as the top tenant-screening factor | 88.4% | Avail 2026 Survey |
| Tenant retention vs turnover ratio | ~5:1 | Avail 2026 Survey |
| Median monthly rent receipt per rental unit | $1,000 | Census 2021 RHFS |
| Median estimated market value per rental unit | $175,000 | Census 2021 RHFS |
3. How much have landlord costs gone up?
Where it hurts. Small landlords on net are not dramatically raising rents — Avail’s data shows 18% maintain a no-increase policy and most who raise charge under 5% — but the bills they receive are not so disciplined. Property taxes, insurance, and maintenance inflation absorb the operating budget. The Federal Reserve’s 2025 FEDS Note found a $1 increase in apartment insurance reduced landlord net income by about 72 cents on the dollar — meaning landlords absorb most cost growth themselves. For multifamily owners, real per-unit insurance has risen more than 75% in five years. The squeeze is not evenly distributed: Florida, coastal Louisiana, coastal Texas, southeastern U.S., and central Midwest saw the steepest insurance hikes.
| Metric | Value | Source |
|---|---|---|
| Independent landlords reporting cost increases this past year | 74.4% | Avail 2026 Survey |
| Independent landlords describing those increases as “significant” | 29.2% | Avail 2026 Survey |
| Real estate investors who saw insurance rise 11%+ this year | 22% (13% saw 20%+) | Baselane 2024 Survey |
| Real estate investors who saw property tax rise 6%+ | 50% (18% saw 11%+) | Baselane 2024 Survey |
| Apartment property insurance, 2019 → 2024 (per unit / month, real) | $39 → $68 (~75%+ increase) | Federal Reserve FEDS Note, Sept 2025 |
| Multifamily property tax cost as share of operating expenses (2023) | 26.3% (up 9.7% YoY) | NAA 2024 Income & Expenses analysis |
| Operating expenses as share of every rent dollar (multifamily) | 93¢ | NAA 2024 |
| Median monthly operating expense per rental unit (excl. debt service) | $380 | Census 2021 RHFS |
| Owners reporting any capital improvement in 2020 | 76% (median spend: $840/unit/year) | Census 2021 RHFS |
| Cost increase that gets passed through to tenants in rent | <1% of average rent (≈$7–12/mo from insurance increases) | Federal Reserve FEDS Note, 2025 |
The Avail “74.4% saw cost increases” figure and the Baselane “22% saw 11%+ insurance hikes” figure measure different things — annual perception across all small landlords vs. specific-band insurance increases among real estate investors. Both are reported as published; readers should not aggregate them.
4. How often do landlords get paid on time?
The myth: small landlords are one missed rent away from foreclosure. The data: most are getting paid most of the time, and most respond to a missed payment with a text message, not a court filing. Chandan Economics’ RentRedi-based rent-collection tracker — covering 65,000+ units of independent-landlord stock — shows on-time payment improving in early 2026 but trailing pre-pandemic norms. Within the jurisdictions the Eviction Lab tracks (~10 full states + ~30 cities — there is no federal eviction-filings database), filings are roughly at pre-pandemic levels with a heavy concentration among large filers. In 15 tracked cities, the top 100 landlords filed 32.6% of all evictions; in Greenville, SC, the top 100 filed 58.2%. Small landlords contribute to the eviction count, but they are not driving it.
| Metric | Value | Source |
|---|---|---|
| Independent-landlord on-time payment rate, April 2026 | 84.5% (forecast full-collection: 97.2%) | Chandan / RentRedi, Apr 2026 |
| Months of consecutive YoY on-time-payment decline through Apr 2026 | 33 | Chandan / RentRedi, Apr 2026 |
| 2–4 unit on-time payment rate (Apr 2026) | 85.3% (single-family: 84.6%; multifamily: 83.7%) | Chandan / RentRedi, Apr 2026 |
| Top-performing state for on-time payments | Alaska, 96.0% | Chandan / RentRedi, Apr 2026 |
| Renters who incurred a late fee in past 12 months (Nov 2024) | 14% (down from a 23% peak in early 2023) | CFPB, Behind on Rent, Jan 2025 |
| Average late fee charged (Nov 2024) | $85 (up from $70 in Sept 2021) | CFPB, Jan 2025 |
| Eviction filings in Eviction Lab tracked jurisdictions, 2023 / 2024 | 1,115,000 / ~1,000,000+ | Eviction Lab, ETS Report 2024 |
| Eviction filings by top 100 filers in 15 tracked cities | 32.6% average per city (peak: 58.2%, Greenville SC) | Eviction Lab, ETS Report 2024 |
| Independent landlords filing eviction as first response to missed rent | 0.81% | Avail 2026 Survey |
| Independent landlords who pursue communication / payment plans first | 78.3% | Avail 2026 Survey |
5. How do small landlords run their rental business?
Three out of four landlords have already moved tenant screening online; barely one in six has done the same for maintenance tracking. Where the digital divide really shows up is bookkeeping — almost a quarter of independent landlords still run their books on paper or spreadsheets, even as portfolios grow into the 5–20 unit range. The cohort is also unusually open to AI for the kind of legal-adjacent question they used to pay a few hundred dollars to ask a property attorney. More than three-quarters of independent landlords are using or open to using AI tools — a high adoption rate for a self-employed segment with low tech-budget norms.
| Metric | Value | Source |
|---|---|---|
| Use digital tools for tenant screening | 65.2% | Avail 2026 Survey |
| Use digital systems for maintenance / repair tracking | 16.2% | Avail 2026 Survey |
| Currently using or open to using AI tools | 75.7% | Avail 2026 Survey |
| Most-common AI use case among landlords | Navigating landlord-tenant issues (21.2%) | Avail 2026 Survey |
| Landlords preferring text messaging for daily tenant interaction | 58.7% | Avail 2026 Survey |
| Average landlord–tenant relationship satisfaction score | 4.15 / 5 | Avail 2026 Survey |
| Tenants staying longer than in previous years (per landlord report) | 36.1% (vs ~7% reporting shorter stays) | Avail 2026 Survey |
If you’re shopping for tools that fit this profile — one to ten units, no in-house bookkeeper, no patience for QuickBooks — most of the market sells per-seat or per-unit subscriptions that scale with portfolio size. A small but growing slice (RentLedger included; see pricing) ships as a one-time purchase to keep cost predictable as the portfolio grows.
6. What renter-side pressures hit small landlords?
Small landlords don’t get to choose how much rent their tenants can pay. The Joint Center for Housing Studies’ affordability data is the relevant macro: an all-time-high 22.4 million renter households pay more than 30% of income on rent and utilities, and the median renter earning under $30,000 has just $310 left after housing. That pressure shows up as longer collection cycles, more payment plans, and more eviction filings — but, as the Avail and Chandan data show, small landlords are absorbing the strain through forbearance and partial collection, not legal action. The institutional cohort behaves differently.
| Metric | Value | Source |
|---|---|---|
| U.S. renter households cost-burdened in 2022 | 22.4 million (~50% of all renters) | JCHS, America’s Rental Housing 2024 |
| Middle-income ($45–75k) renter households cost-burdened | 41% | JCHS, State of the Nation’s Housing 2024 |
| Median monthly residual income for sub-$30k renter (after housing) | $310 (all-time low) | JCHS, America’s Rental Housing 2024 |
| Professionally-managed apartment rents, 2020–early 2024 | +26% cumulative; +0.2% YoY by early 2024 | JCHS, State of the Nation’s Housing 2024 |
| Single-family rental households (2024) | 14.4 million | Arbor analysis of Census ACS |
| Renters carrying any past-due rent balance (Nov 2024) | ~3% (down from ~5% Sept 2021); median balance $3,200 | CFPB, Behind on Rent, Jan 2025 |
Small Landlord Statistics 2026 — by the Numbers
| Metric | Value | Source |
|---|---|---|
| Total U.S. rental properties | 19.3 million | Census 2021 RHFS |
| Total U.S. rental units | 49.5 million | Census 2021 RHFS |
| Share of properties owned by individual investors (all sizes) | ~70% | Census 2021 RHFS |
| Share of single-unit rentals owned by individuals, 2021 | 70.9% | Chandan/2024 RHFS analysis |
| Share of single-unit rentals owned by individuals, 2024 | 59.6% | Chandan/2024 RHFS analysis |
| Share of rental properties containing only one rental unit | 86% | Census 2021 RHFS |
| Independent landlords with 1–4 units | 72.6% | Avail 2026 Survey |
| Independent landlords with ≤3 years’ experience | 47.4% | Avail 2026 Survey |
| Plan to add property in next 2 years | 32.9% | Avail 2026 Survey |
| Saw ownership costs rise this year | 74.4% | Avail 2026 Survey |
| Saw property tax rise more than 6% | 50% | Baselane 2024 Survey |
| Saw insurance rise more than 11% | 22% | Baselane 2024 Survey |
| Apartment insurance per unit per month, 2024 (real) | $68 (vs $39 in 2019) | Fed FEDS Note 2025 |
| Median rent receipt per unit | $1,000 / month | Census 2021 RHFS |
| Median operating expense per unit | $380 / month | Census 2021 RHFS |
| April 2026 on-time payment rate (independent landlords) | 84.5% | Chandan / RentRedi, Apr 2026 |
| 2024 eviction filings in Eviction Lab tracked jurisdictions | ~1 million+ | Eviction Lab |
| Top-100-landlord share of evictions in 15 tracked cities | 32.6% avg | Eviction Lab |
| Independent landlords using or open to AI | 75.7% | Avail 2026 Survey |
| U.S. cost-burdened renter households (2022) | 22.4 million | JCHS 2024 |
Methodology and Sources
We aggregated 48+ data points from 16 unique sources, prioritizing primary government surveys (Census Bureau RHFS, Federal Reserve FEDS Notes, CFPB consumer-finance datasets, IRS SOI, GAO reports), academic housing research (Harvard’s Joint Center for Housing Studies, the Eviction Lab at Princeton, Urban Institute), and disclosed-methodology industry surveys (Avail’s 2026 Independent Landlord Survey of 4,055 respondents; Baselane’s 2024 Real Estate Investor Survey of ~2,116; Chandan Economics / RentRedi’s monthly rent-collection tracker covering 65,000+ units). Every stat traces to a primary source linked inline. Where the most recent comprehensive data predates 2024, we flagged it. We did not cite RentLedger’s own data — this is a public-data roundup. Authorship and editorial standards are documented at our About page.
We update this page quarterly. Where the 2024 RHFS publishes additional summary tables, we will replace 2021-vintage figures with their 2024 equivalents.
Last verified: April 2026
Sources:
- U.S. Census Bureau / HUD — 2021 Rental Housing Finance Survey (announcement)
- U.S. Census Bureau — 2024 Rental Housing Finance Survey release (Feb 2026)
- Congressional Research Service — Ownership of the U.S. Rental Housing Stock by Investor Type (R47332)
- Chandan Economics — Census 2024 RHFS analysis
- Chandan Economics / RentRedi — Independent Landlord Rental Performance Report, April 2026
- Joint Center for Housing Studies, Harvard — America’s Rental Housing 2024
- Joint Center for Housing Studies, Harvard — State of the Nation’s Housing 2024
- Federal Reserve Board — Rising Property Insurance Costs and Pass-Through to Rents for Apartment Buildings (FEDS Notes, Sept 2025)
- Consumer Financial Protection Bureau — Behind on Rent: Examining Rental Housing Delinquencies in New Payment Data (Jan 2025)
- Eviction Lab — Preliminary Analysis: Eviction Filing Patterns in 2024
- Eviction Lab — Preliminary Analysis: Eviction Filing Patterns in 2023
- Urban Institute — Institutional Owners in Single-Family Rental Properties (2023)
- GAO — Rental Housing: Information on Institutional Investment in Single-Family Homes (GAO-24-106643, May 2024)
- Avail (by Realtor.com) — 2026 Independent Landlord Survey, n=4,055
- Baselane — 2024 Real Estate Investor Survey, n≈2,116
- National Apartment Association — 2024 Income & Expenses analysis
- Arbor — Single-Family Rentals Reach 7-Year High (Census ACS analysis)
Frequently Asked Questions
How many small landlords are there in the United States?
The U.S. Census Bureau’s 2021 Rental Housing Finance Survey counts 19.3 million rental properties, with about 70% owned by individual investors. That works out to roughly 13.5 million individual-investor-owned rental properties (Census 2021 RHFS). The most recent (2024) RHFS release shows individual investors still own 59.6% of single-unit rental properties, down from 70.9% in 2021 (Chandan analysis).
What share of rental units are owned by mom-and-pop landlords?
Per the 2021 RHFS analyzed by the Congressional Research Service, individual investors own 70% of rental properties but only 38% of all rental units — because their properties are smaller. In the 1–4 unit segment specifically, individual investors own 15.9 million units, or about 70% of small-rental units (Census 2021 RHFS).
What share of single-family rentals is owned by Wall Street?
The Urban Institute estimates large institutional investors (1,000+ homes in 3+ markets) own about 3% of single-family rentals — less than 0.5% of the total single-family stock (Urban Institute). Concentration is heavier in Sun Belt metros: Atlanta (25%), Jacksonville (21%), Charlotte (18%).
How much have rental property costs risen for small landlords?
74.4% of independent landlords saw ownership costs rise in the past year (Avail 2026 Survey). Apartment property insurance alone rose ~75% in real terms from 2019 to 2024, per a Federal Reserve FEDS Note — from $39 to $68 per unit per month (Fed, 2025).
Are small landlords actually getting paid on time?
Yes — mostly. The Chandan Economics / RentRedi Independent Landlord Rental Performance Report puts the on-time payment rate at 84.5% in April 2026, with a forecast full-payment rate of 97.2%. On-time rates are 119 basis points below April 2025, the 33rd consecutive month of annualized declines (Chandan / RentRedi, Apr 2026).
How many landlords still use spreadsheets for bookkeeping?
A Hemlane survey of ~600 landlords found that more than a quarter of owners managing 21–100 units still rely on spreadsheets, and the National Association of Independent Landlords reports that 23% of independent landlords still use pen and paper or spreadsheets for accounting. For step-by-step bookkeeping help, see our support FAQs.